Make six-sector work using smart antennas, Part 2
By Ji-Hae Yea
Network Engineer, Metawave Communications Corp.
Table of contents
Deployment summary
Measuring capacity gain
Capacity results
Quality of service
Easy reconfiguration
About the author
Examining a specific deployment often is the best way to illustrate a system's advantages. Metawave Communications recently deployed its SpotLight 2000 CDMA smart antenna system in multi-sector configurations with four objectives:
- Demonstrate the ease and cost-effectiveness of deploying multi-sector with smart antennas.
- Significantly increase the capacity of the cell over the three-sector baseline, and to quantify this increase.
- Maintain or enhance quality of service relative to the three-sector baseline, not only in the case-study cell but in neighboring cells.
- Demonstrate the ability afforded by smart antennas to reconfigure a cell from four- to five- to six-sector through software control.
The cell where the deployment occurred is a busy suburban site in the network of a major U.S. cellular operator. The site was originally configured in three-sector using conventional antennas and a Nortel Networks CDMA Metro Cell base station.
The site is configured with two CDMA carriers. Rather than employing a hashing algorithm to allocate traffic between the two carriers, the operator has implemented an overflow algorithm that directs traffic to the second carrier (F2) only when the first (F1) reaches its capacity limit. This feature provided a convenient method for measuring the capacity improvement provided by the smart antenna deployment, as discussed below.
Baseline switch statistics showed that traffic was distributed relatively equally among the three original sectors of the cell, with the alpha, beta, and gamma sectors carrying on average 32%, 39%, and 29% of the total load, respectively. As each sector of a perfectly balanced cell would carry 33.3% of the load, the "peak load" in the beta sector can be expressed as being about 117% of "ideal." This figure represents much more balanced loading than is often observed in commercial CDMA cell sites. Metawave's experience in using smart antennas to generate custom sector patterns to balance traffic loading in three-sector sites suggests that load balancing renders significant capacity benefits when peak loading is greater than 120%. But cells like this one, in which the absolute traffic load is very high and evenly distributed, are ideal candidates for the six-sector solution.
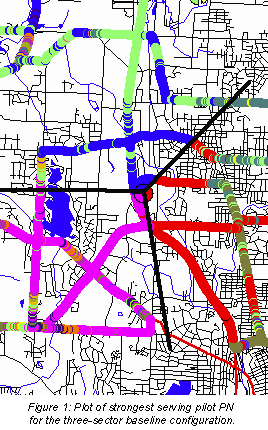
Prior to system installation, the RF footprint of the cell was determined empirically with CDMA drive-test equipment. Figure 1 shows the plot of the strongest serving pilot PN offset for the baseline configuration. Subsequently, the system was installed, and commercial traffic was cut over to the system initially in a three-sector configuration that duplicated the sector orientation and coverage of the baseline configuration. Then, after installation of a second Metro Cell base station, the site was taken to six sectors.
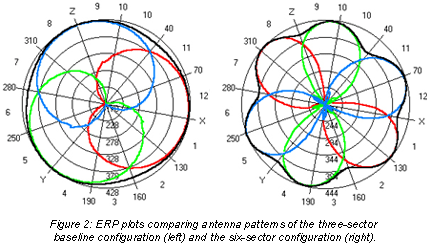
The proprietary smart antenna RF modeling software tool, BeamController, was used to ensure that the six-sector footprint was consistent with the baseline footprint. "Before" and "after" ERP plots of the two configurations are shown in Figure 2. The footprint of the six-sector pattern was also verified through drive-testing; the six-sector strongest serving pilot PN offset plot is shown in Figure 3.
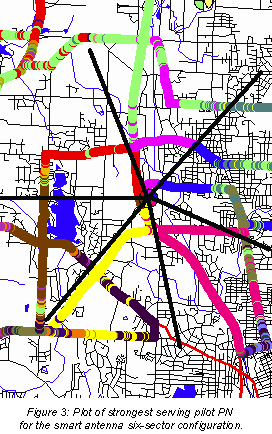
Four- and five-sector configurations were also implemented and measured in commercial service. All sectorization changes after the initial cut-over to the smart antenna system were implemented through remote software control of the beamwidth, azimuth pointing angle, and per-beam gain of the synthesized antenna patterns. No physical changes to the antenna tower were required.
Measuring capacity gain (Back to top)
Measuring the capacity of a CDMA cell site is not straightforward, and therefore, it is typically difficult to quantify the precise capacity improvement attributable to a configuration change. However, the way the operator of this network implemented F2 provides a convenient means of estimating capacity gain in this instance.
Users are assigned to F2 only after traffic on F1 causes the base station to exceed an operator-established threshold of 67% of maximum transmit power. Thus, any call completions on F2 can be considered as having been blocked on F1. The probability of a call's being blocked can be expressed as the grade of service (GOS), which can be calculated for this cell from switch statistics by:

where TF1 and TF2 are the number of call completions over a given time on F1 and F2, respectively. For any given level of traffic, therefore, a low GOS indicates that F1 is carrying most traffic and that relatively little blocking would be present if F2 were absent; a high GOS indicates that a high level of blocking would occur without F2.
To assess the efficiency of the cell under different sectorization schemes, the observed GOS can be plotted against call completions. An efficiency curve can then be computed using the Erlang B model that best fits the observed data. The general Erlang B model is given by:

where C is the number of trunked channels offered by a trunked radio system, and A is the total offered traffic in Erlangs. In determining the best-fit curve, the value of C is chosen to minimize the squared error between the observed GOS at a given level of traffic and the predicted GOS from the model for the same level of traffic. Offered traffic, A, is taken to be the number of call completions in a given hour (TF1 + TF2) multiplied by a constant representing assumed average call duration.
The Erlang B model does assume a fixed-trunk air interface, and CDMA does not strictly meet this criterion, as the number of available channel elements varies with, among other factors, the forward-link power requirements and the handoff state of the mobiles being served. However, over time, there is an average number of "available" channel elements, and thus the Erlang B model still provides a good approximation of GOS for a CDMA cell.
Capacity results (Back to top)
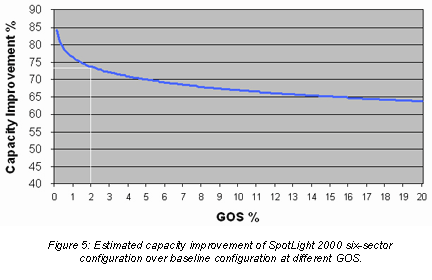
The results of the analysis are presented in Figures 4 and 5. Figure 4 shows the best-fit Erlang B curves relating GOS to offered traffic for the baseline three-sector and smart antenna six-sector configurations using data from the 4:00–5:00 p.m. busy hour. It is appropriate to concentrate on the busy hour because this is when any capacity gains afforded by six-sector will be most valuable to the network operator—in terms of both network efficiency and revenue. Data were collected over fifteen consecutive days for the baseline configuration and more than twelve consecutive days for the six-sector configuration.
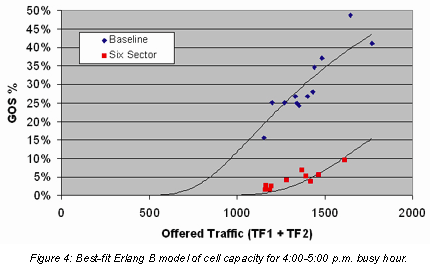
Figure 4 shows that the smart antenna six-sector configuration resulted in a significant rightward shift in the best-fit curve. This indicates that, at a given GOS, the six-sector cell was carrying more offered traffic. Figure 5 presents the magnitude of this increase at various grades of service. At a reasonable 2% GOS (i.e., a 2% access failure rate), the smart antenna system in six-sector increases capacity by 73.6%.
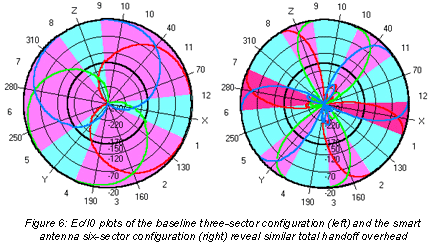
This significant increase in cell capacity can be attributed to the control of handoff overhead. Figure 6 compares Ec/I0 plots for the baseline three-sector configuration with conventional antennas and the smart antenna six-sector configuration. The size of the inter-sector softer handoff regions—and thus the amount of handoff overhead—is indicated by the darker shaded areas. By inspection, the amount of handoff overhead appears roughly equivalent between the two configurations. In fact, as measured by the ratio of Walsh-code Erlangs to primary Erlangs, handoff overhead increased less than 7% in moving from the three-sector baseline to the six-sector configuration (1.86 to 1.99), despite the 100% increase in the number of handoff zones. What this means is that, in contrast to the conventional six-sector case, scarcely any of the capacity gains of a six-sector deployment facilitated by smart antennas are squandered on unproductive overhead; they are instead available to carry revenue-producing traffic.
Quality of service (Back to top)
The main purpose of the six-sector deployment was certainly to provide increased site capacity, and the smart antenna system delivered on that promise. But capacity gain in any single cell would not be very worthwhile if it came at the expense of quality of service (QoS) in the cell itself or, just as important, in neighboring cells. The case study results show that, overall, the smart antenna deployment maintained and in some ways actually enhanced the performance of the study cell and its neighbors.
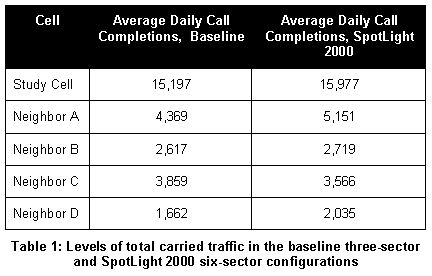
To make meaningful QoS comparisons, it is first necessary to establish that the levels of carried traffic before and after the implementation are roughly comparable. The switch data on call completions presented in Table 1 demonstrate that this was the case, both in the study cell and its neighbors.
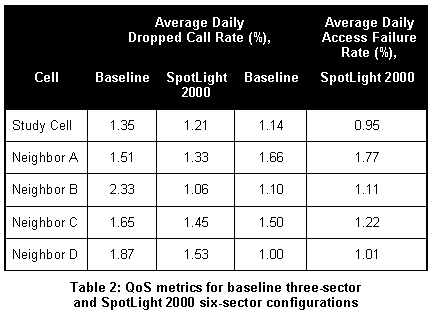
Typically, six-sector deployments using conventional antennas suffer QoS problems due to excess pilot pollution. In areas where a dominant server does not exist because of pilot pollution, one would expect significant problems with dropped calls and access failures. As Table 2 shows, the smart antenna six-sector deployment belied these expectations. The dropped call rate fell by between 10% and 55% in every cell in the cluster. With regard to access failures, three cells experienced slight increases (of between roughly 1% and 7%), while two others experienced decreases of almost 20%. On balance, the smart antenna system in six-sector delivered enhanced QoS along with greater capacity.
Easy reconfiguration (Back to top)
A final goal of the deployment was to demonstrate the flexibility of smart antenna systems in reconfiguring a site from one sectorization scheme to another through software control. As its name implies, the Flexible Sectorization feature of the system makes it practical for an operator to take a site from three- to four-, five- or six-sector and back again as traffic, RF, and network environments change. As an example of the real-world usefulness of this feature, imagine implementing a three-sector smart antenna solution to balance traffic loading in a highly imbalanced cell.
A year later, after a new shopping mall, freeway, and housing development have appeared within the footprint of the cell, one might conclude that the heavy loading across all three sectors indicated a six-sector solution. And a year after that, one might decide to take the site back to four sectors to help manage pilot pollution arising from a new neighboring off-load site. Smart antennas provide the flexibility to make such changes with minimal base-station equipment changes and with no changes to the antennas on the tower.
As a demonstration of this flexibility, the study site was operated for five days each in four- and five-sector configurations. The estimated capacity increases, dropped call rates, and blocking rates for these two configurations relative to the baseline three-sector configuration are presented in Table 3.
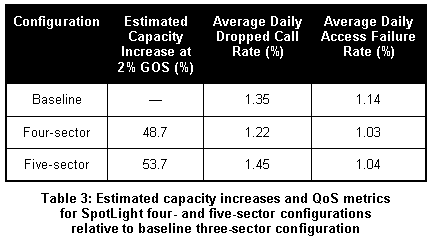
It is worth noting that, because the goal of this deployment relative to the four- and five-sector configurations was simply to demonstrate how smart antennas enable easy, software-controlled sectorization changes, neither configuration was optimized in any systematic way. Both the four- and five-sector configurations feature large enough beamwidths to provide real scope for traffic load balancing using the smart antenna system's ability to adjust beamwidth and orientation, as in the well-proven three-sector case. One could expect this effort to produce incremental capacity gains beyond those reported in Table 3, as those gains resulted entirely from the increased number of sectors.
No single sectorization scheme will prove optimal for every capacity-constrained CDMA cell. In many instances, the apparent capacity problem stems less from an absolute shortage of site capacity than from the uneven distribution of traffic among sectors. In such cases, using smart antennas to balance traffic loading by customizing sector size and orientation can "unlock" capacity that is sitting idle in under-used sectors and boost site capacity (by as much as 50%) without exacerbating problems of pilot pollution or neighbor list planning.
However, in cells where the traffic load is well balanced among the three sectors—and balanced at an unacceptably high level—then a six-sector configuration with smart antennas can create new capacity. In intermediate cases, the technology can both create additional sectors for greater capacity and distribute traffic more evenly across those sectors to boost site efficiency.
As subscriber numbers continue to soar and as the predicted demand for data traffic begins to materialize, CDMA network operators will need to use all available tools and strategies to meet the attendant capacity challenges. Smart antennas will certainly be among the most flexible and cost-effective of those tools, and using such systems to facilitate flexible, multiple sectorization schemes will likely be among the most promising strategies.
About the author (Back to top)
Ji-Hae Yea is a network engineer at Metawave Communications Corp., Redmond, WA, USA.
He can be reached at Metawave Communications Corp., 10735 Willows Road NE, Redmond, WA 98502; phone: 425-702-6573; fax: 425-702-5679; ji-hae.yea@metawave.com.
